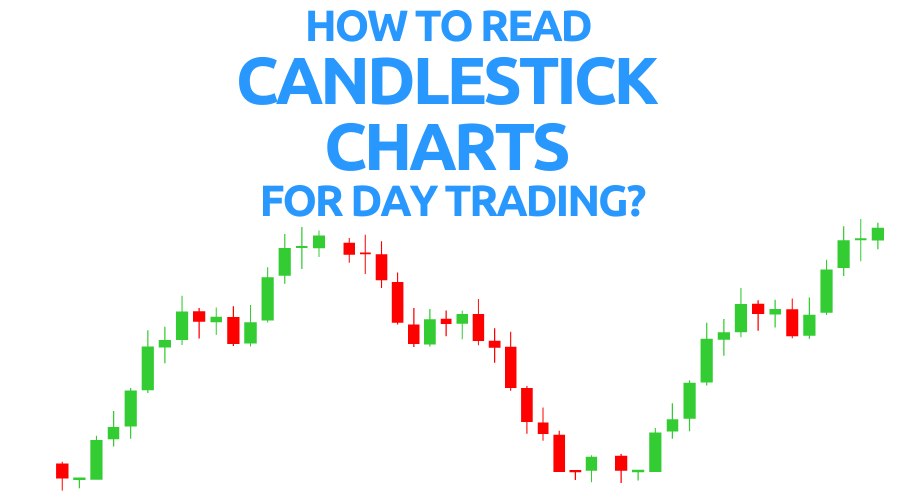
Intraday trading involves buying and selling financial instruments within the same day, making it crucial to understand market behavior in real time. Candlestick charts are among the most powerful tools that traders use to visualize stock price movements and predict market direction. In this guide, we’ll explore how to read candlestick charts for intraday trading and explain why mastering this skill is essential for beginners.
Why Candlestick Charting is Essential for Beginners
Candlestick charts offer traders a clear and detailed snapshot of market sentiment. With the open, high, low, and close (OHLC) data packed into a single “candle,” this charting technique provides insights into the battle between buyers (bulls) and sellers (bears). Compared to other charting methods like line or bar charts, candlestick patterns reveal more about price action, helping beginners make well-informed trading decisions.
What Are Candlestick Charts?
Candlestick charts are visual tools that display price action over a specified time frame. Each candlestick is formed using four pieces of data: the opening price, the highest price, the lowest price, and the closing price for the selected period.
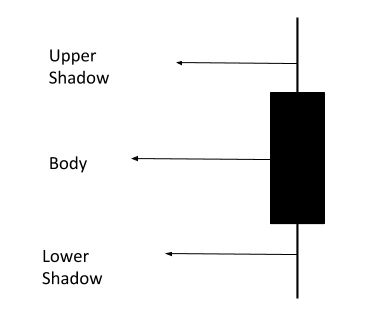
Components of a Candlestick Chart:
- The Body: Represents the difference between the opening and closing price. A green body indicates a price increase (bullish), while a red body signifies a price decrease (bearish).
- Upper Shadow (Wick): Shows the highest price traded during the time period.
- Lower Shadow(Wick): Displays the lowest price during that period.
Each candle is a representation of a time period and the data corresponds to the trades executed during that period.
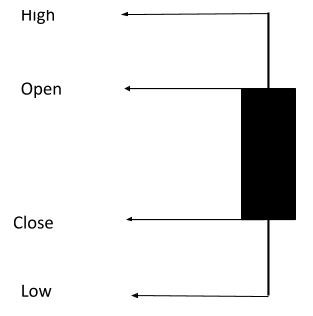
Each candlestick shows four key data points:
- Open: The price at which the stock starts trading during the time period.
- High: The highest price reached during the time period.
- Low: The lowest price reached during the time period.
- Close: The price at which the stock ends trading for that time frame.
These candlesticks provide traders with a quick snapshot of market activity and sentiment during the selected period.
How to Analyze Candlestick Charts
Analyzing candlestick charts requires an understanding of how to interpret the body and shadows (wicks).
- Body Size: A long body indicates strong buying or selling pressure, while a short body suggests low volatility or indecision in the market.
- Shadows (Wicks): Long shadows indicate high volatility. For example, a long upper shadow shows that prices rose but were pushed back down by selling pressure, while a long lower shadow suggests that prices fell but were driven back up by buyers.
Key Insights:
- If a candle has a short upper wick on a red body, it means the stock opened near the high price but closed lower.
- Conversely, a short upper wick on a green body indicates that the stock closed near the high price.
This analysis helps traders quickly assess market sentiment and potential price movement, making candlestick charts invaluable for intraday trading.
Candlestick Chart Patterns
Candlestick patterns allow traders to assess market trends and predict future price movements based on past behavior. Traders must remember that while an individual candle provides sufficient information, patterns can be determined only by comparing one candle with its preceding and next candles. To benefit from them, it is important that traders understand patterns in candlestick charts.
These patterns are often used to identify bullish and bearish reversals, continuation patterns, or periods of consolidation.
Bullish Patterns
1. Hammer Pattern
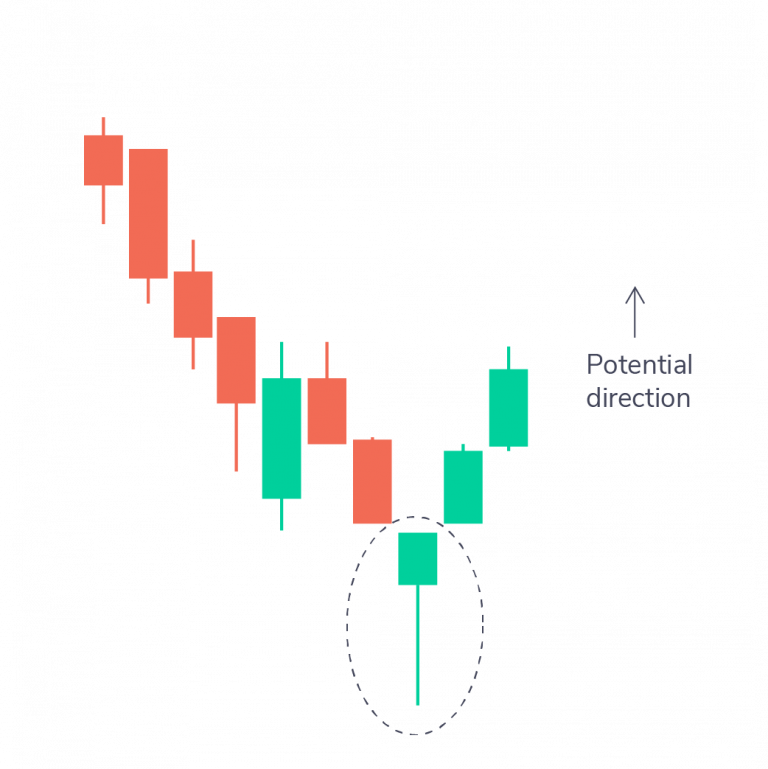
The hammer is a candle with a small body and a long lower shadow. It typically appears at the bottom of a downtrend, signaling a potential reversal. The long lower wick shows that buyers pushed the price up despite selling pressure.
2. Inverse Hammer Pattern
The inverse hammer has a short body and a long upper shadow. It also appears at the bottom of a downtrend and suggests potential buying pressure, signaling a bullish reversal.
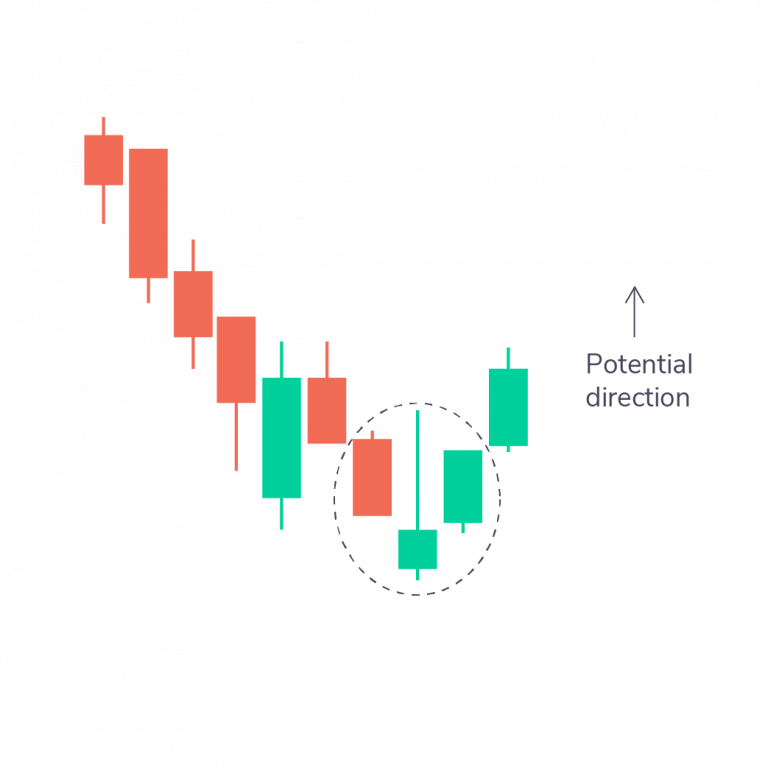
3. Bullish Engulfing Pattern
This two-candle pattern consists of a small red candle followed by a larger green candle. It signals a strong bullish reversal, where the buyers take over after the initial selling pressure.
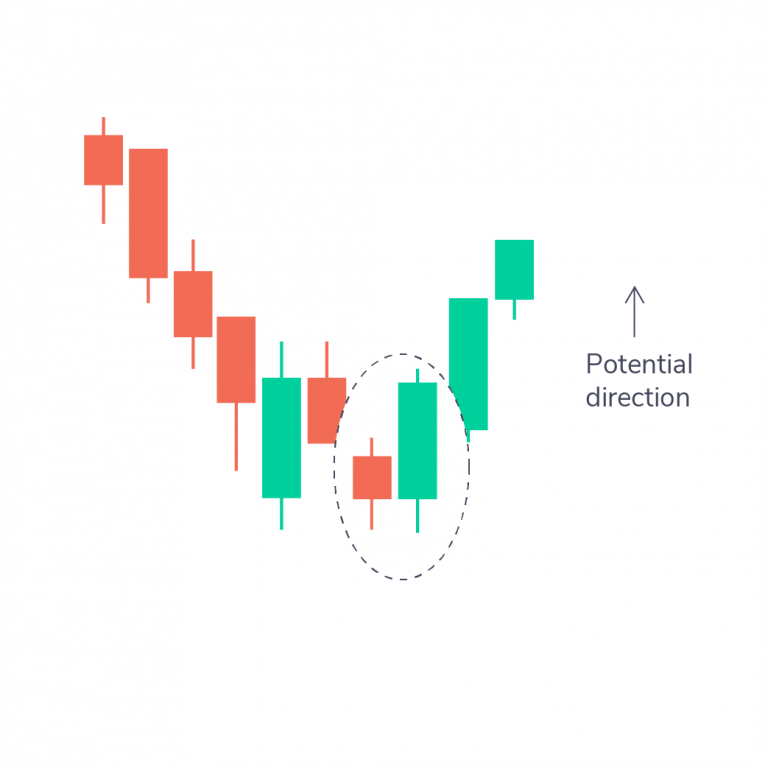
4. Piercing Line Pattern
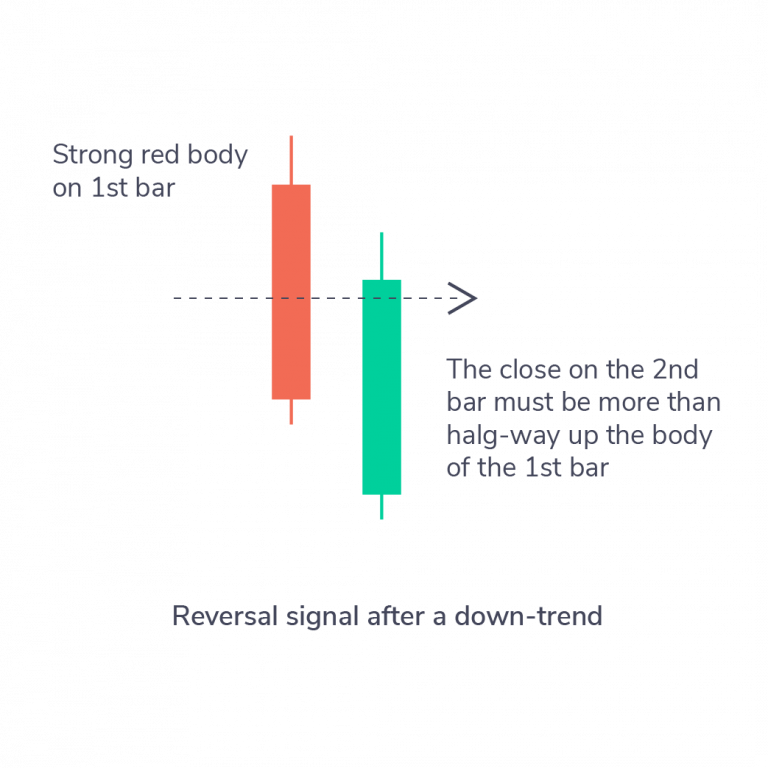
A two-candle pattern where a long red candle is followed by a long green candle. The green candle’s closing price should be above the midpoint of the red candle, indicating strong buying pressure.
5. Morning Star Pattern
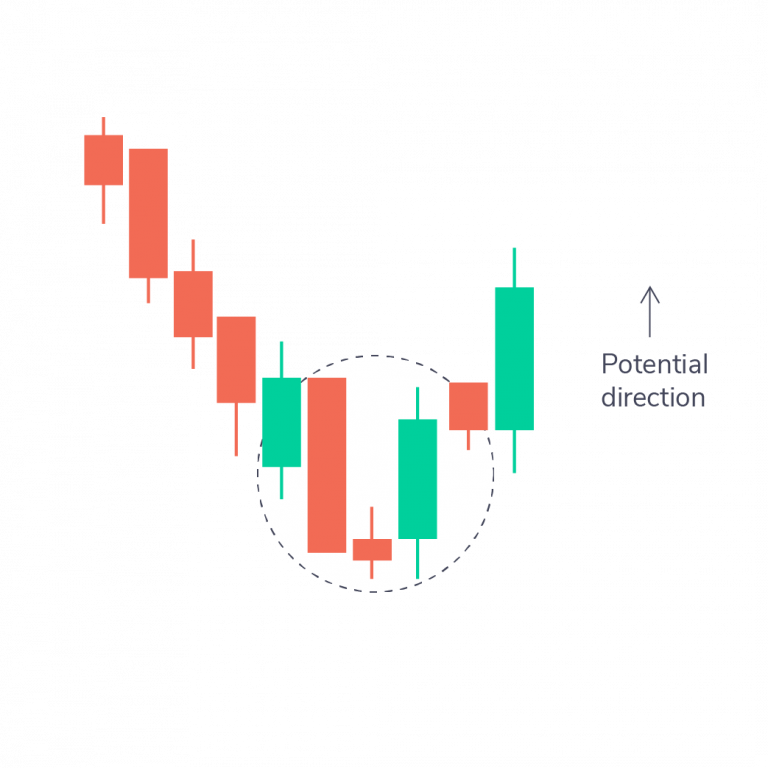
This is a three-candle pattern that indicates a bullish reversal. It consists of a long red candle, a small-bodied candle, and a long green candle. The morning star pattern signals that the selling pressure is weakening, and the buyers are gaining control.
6. Three White Soldiers Pattern
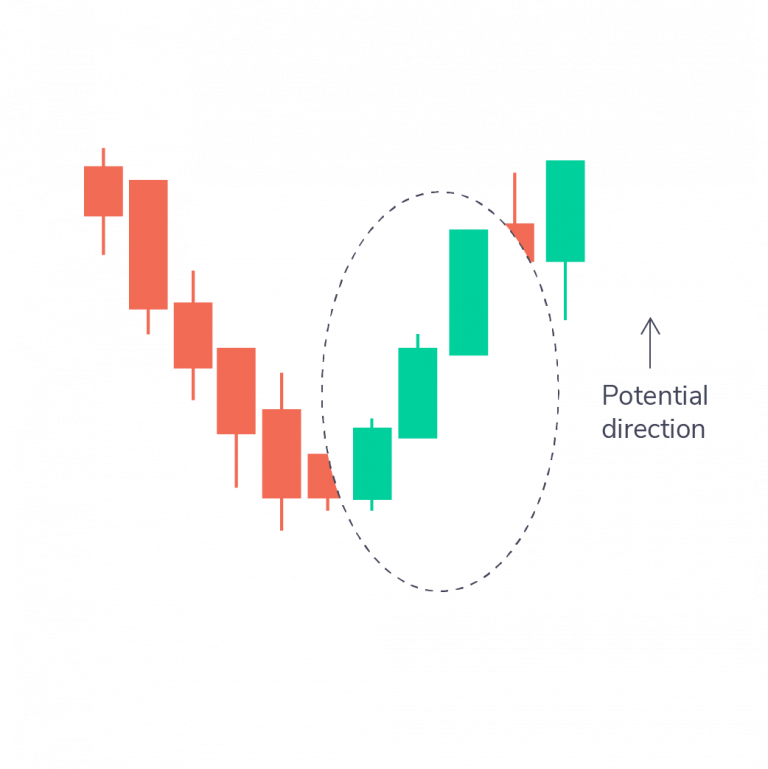
This pattern features three consecutive green candles with short wicks. It signals a strong upward trend after a downtrend, as each candle opens higher than the previous one and closes near its high.
Bearish Patterns
Hanging Man Pattern
The hanging man has a small body and a long lower shadow, appearing at the top of an uptrend. It indicates that selling pressure is beginning to take over and that the bulls are losing momentum.
Shooting Star Pattern
This pattern has a short body and a long upper wick. The market opens higher than the previous day, rallies upward, and then crashes back down, resembling a shooting star. It signals a bearish reversal at the top of an uptrend.
Bearish Engulfing Pattern
A two-candle pattern where a small green candle is followed by a large red candle. This pattern usually occurs at the top of an uptrend and signals a potential bearish reversal as the bears take control.
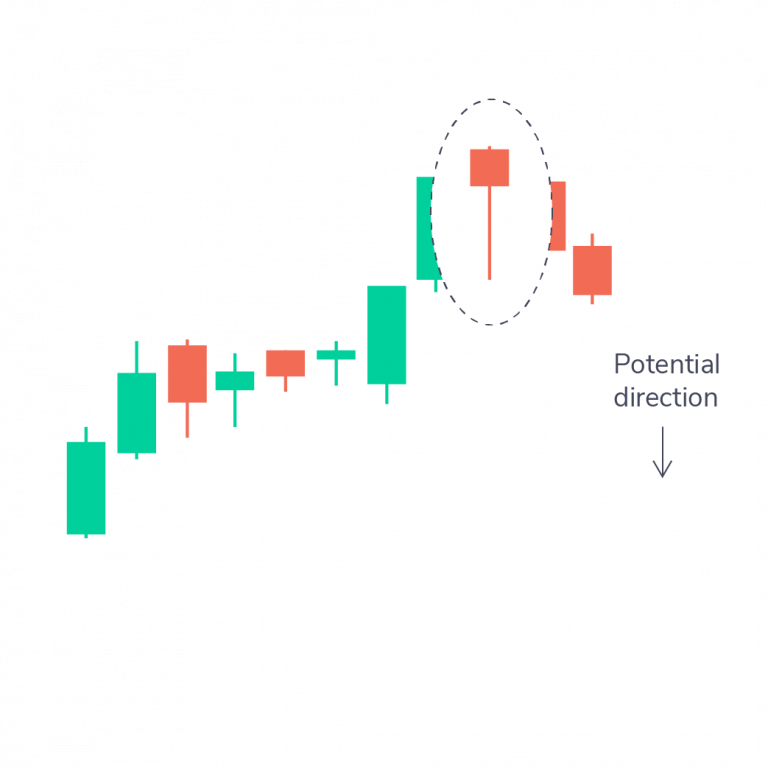
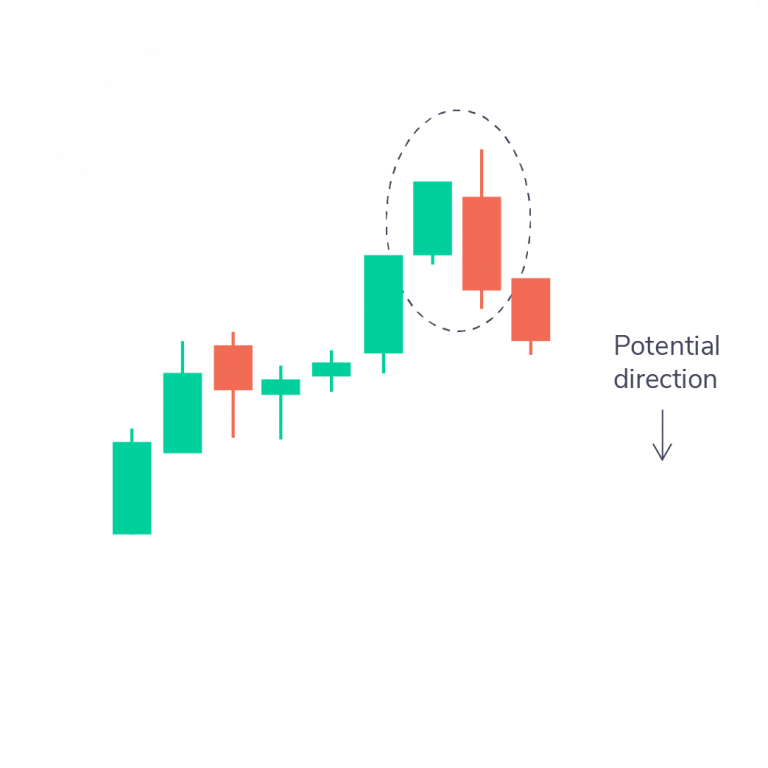
Evening Star Pattern
Similar to the Morning Star, this is a three-candle pattern, but it appears at the top of an uptrend. It signals a bearish reversal with a small-bodied candle between a long green candle and a long red candle.
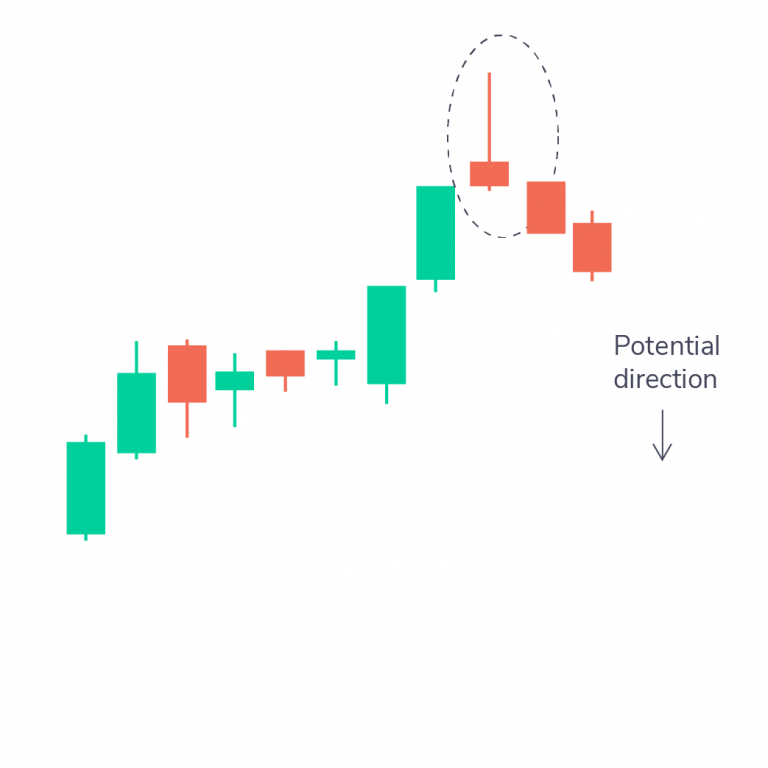
Three Black Crows Pattern
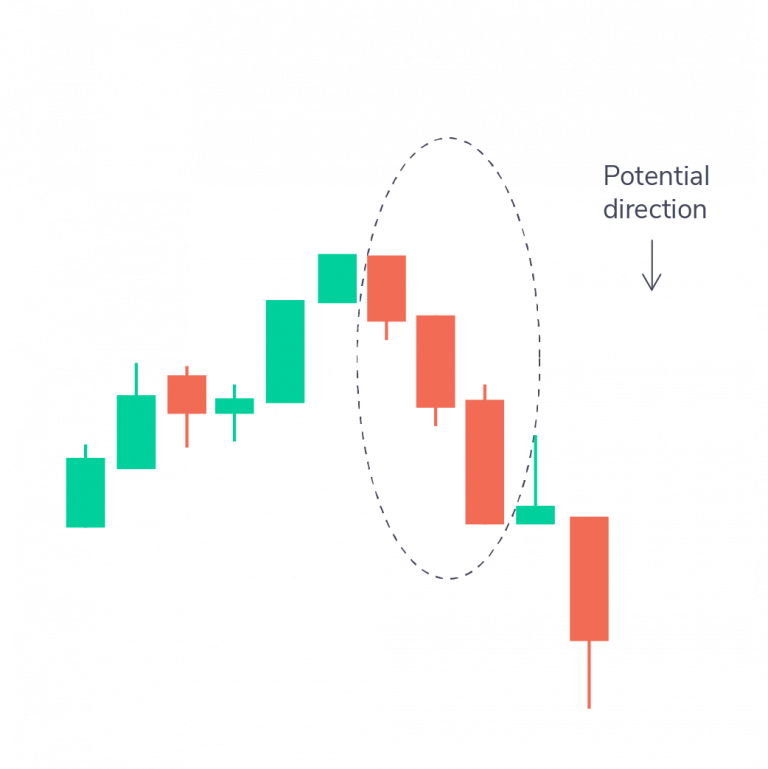
This pattern consists of three consecutive red candles with small wicks. It signals a strong bearish trend after an uptrend, as each candle opens lower than the previous day and closes near its low.
Common Mistakes to Avoid When Reading Candlestick Charts
- Overlooking Shadows (Wicks): Shadows can reveal critical information about market volatility and sentiment, so don’t ignore them.
- Interpreting Patterns in Isolation: Patterns should always be considered within the context of the overall trend and volume data for more accurate predictions.
- Neglecting Timeframes: Different timeframes tell different stories. For intraday trading, focus on short timeframes like 1-minute, 5-minute, or 15-minute charts.
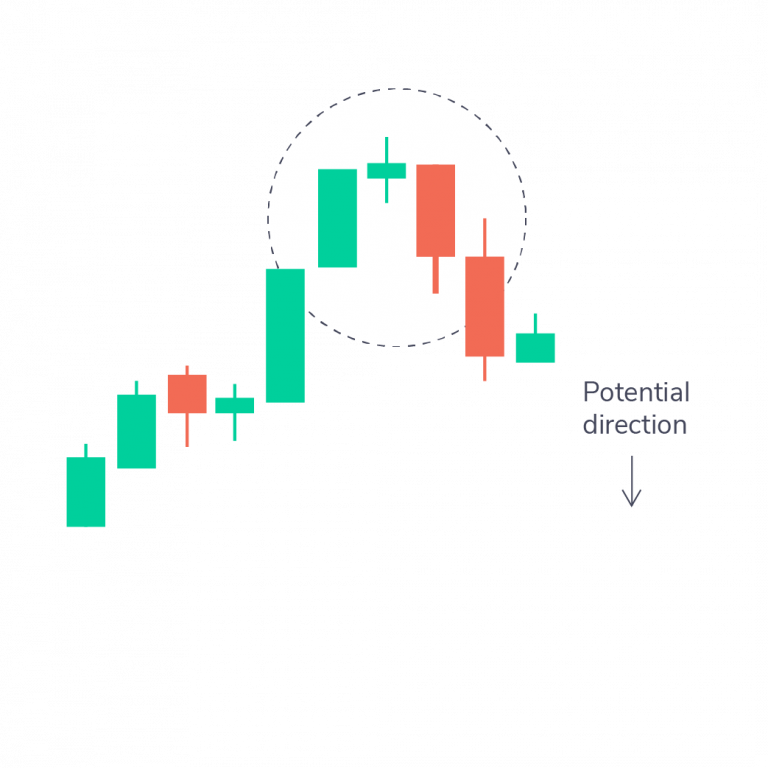
Candlestick Chart Patterns for Intraday Trading
While single candlesticks provide essential information, candlestick chart patterns combine multiple candles to predict trends. These patterns are divided into bullish and bearish categories, helping traders determine whether to enter or exit a position.
Continuation Patterns
These patterns indicate that the current trend is likely to continue. Examples include the Rising Three Methods (bullish continuation) and Falling Three Methods (bearish continuation).
Reversal Patterns
Reversal patterns signal that the current trend may change direction. Patterns like the Double Top and Double Bottom are classic reversal signals in candlestick chart analysis.
FAQs: Common Questions About Candlestick Charting for Intraday Trading
- How reliable are candlestick patterns? Candlestick patterns are more reliable when combined with other technical indicators like volume, moving averages, and market trends.
- Can candlestick patterns be used for long-term trading? While most commonly used in short-term trading, candlestick patterns can also provide valuable insights for longer time frames.
- What’s the difference between candlestick and bar charts? Candlestick charts provide more visual detail on price movements, while bar charts focus on open, high, low, and close with less visual clarity.
- Can I automate candlestick pattern detection? Yes, various trading platforms like TradingView and MetaTrader offer tools and indicators to automatically identify candlestick patterns.
Leave a Reply